See your whole menu's profitability in a single view
MenuCost's Reports tab pulls profitability, payroll, and allergen data into one live view - and packages it into a professionally styled 7-sheet Excel workbook ready to download at any time.
WHY THIS MATTERS
Costing individual recipes is the start. Seeing the whole picture is where decisions happen.
When you cost recipes individually, you get accurate numbers - but you see them in isolation. The lamb kofta costs 9.01 SAR per serving. The grilled chicken salad costs 12.97 SAR. Those numbers are correct, but they don't tell you which item has the best margin, what your total monthly payroll is doing to your overhead, or whether any item on your menu contains sesame that a customer with an allergy needs to know about.
Menu decisions - what to reprice, which items to feature, how to respond when a supplier raises prices - are made across the business, not inside individual recipes. The Reports tab gives you that whole-business view: a live dashboard summary, three detailed report panels, and a downloadable Excel workbook that captures everything in one file.
Example: A restaurant manager opens the Reports tab after updating three ingredient prices. The Menu Cost Summary immediately shows that the Classic Hummus food cost percentage has risen from 38% to 46% — above the 40% threshold. Before MenuCost, discovering that same problem would have meant manually checking each affected recipe. The report surfaces it in seconds, from the same screen that shows payroll costs and allergen status for the entire menu.
Ingredient prices change. Labour costs shift. Menus grow. Reports give you a way to stay on top of all of it - regularly and quickly - rather than discovering margin problems after they've been running for months.
HOW IT WORKS
Four things the Reports tab shows you - all from one screen
Business summary — four key numbers at a glance
Menu Cost Summary - profitability by item with FC% and margin
Every active menu item is listed with its cost per serving, food cost percentage (FC%), and gross margin. Items are colour-coded — green for healthy margins, orange for items approaching your threshold, red for items below it. The same data shown two ways so you can read it however you're used to.
Payroll Summary - monthly staff cost by person and department
Full Business Report - a 7-sheet Excel workbook, one click to download
Above the live report panels sits the Full Business Report export card. One click generates a professionally styled, colour-coded Excel workbook covering seven areas of your business - from recipe details to the allergen matrix. The file is formatted and ready to share as-is.
REAL EXAMPLE
What the Reports tab looks like inside MenuCost
A live snapshot of the Reports tab - dashboard summary, Full Business Report download card, and Menu Cost Summary and Payroll Summary side by side..
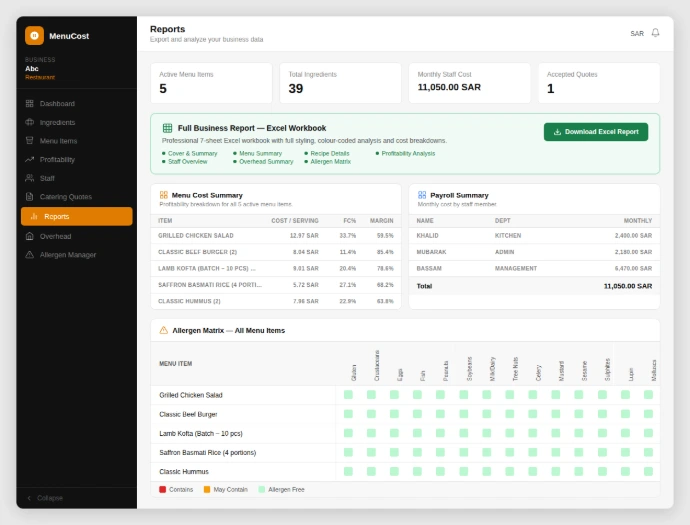
The Classic Hummus food cost percentage at 46.2% is above the typical 40% threshold — flagged in red, visible immediately. The Classic Beef Burger at 11.4% FC% is the strongest margin item on the menu. Both pieces of information are visible in the same 30-second view, alongside the total monthly payroll and the download button for the full Excel report.
WHAT YOU GET
What changes when your whole business is in one report
- A complete business snapshot that's always current. The Reports tab reflects your live data. Every time you open it, the Menu Cost Summary, Payroll Summary, and Allergen Matrix show the current state of your operation - not last week's numbers, not a manually maintained sheet.
- Margin problems surface immediately after any cost change. Update an ingredient price and the Menu Cost Summary shows the new FC% and margin for every affected item. A problem that used to take an afternoon to find now takes thirty seconds to spot.
- A professional Excel report in one click. The 7-sheet workbook is styled and colour-coded — not a raw export that needs reformatting. It's the file you hand to a business partner, present at a bank meeting, or keep as a monthly record of your operation.
- Allergen compliance documentation built from your recipes. The Allergen Matrix is generated from the allergen tags already on your ingredients. Sheet 7 of the Excel workbook is ready to share with a client, regulator, or event organiser without any additional work.
- Payroll and food cost visible in the same view.Staff cost feeds overhead, which feeds recipe cost. Seeing monthly payroll alongside menu profitability in the same tab makes that connection explicit — and makes it clear when a staff cost change needs to flow through to your pricing.
QUESTIONS
The report downloads as a standard .xlsx file which opens in Microsoft Excel, Google Sheets, Apple Numbers, and any other spreadsheet application that supports the Excel format. The colour coding and styling are preserved in Excel and Google Sheets. Some minor formatting differences may appear in other applications, but the data and structure remain intact.
The live report panels in the Reports tab - Menu Cost Summary, Payroll Summary, and Allergen Matrix - always reflect your current data. When you click Download Excel Report, the workbook is generated from that live data at the moment of download. If you change an ingredient price after downloading, open the Reports tab and download again for a fresh, updated file.
FC% stands for Food Cost Percentage — the share of the selling price taken up by the total cost of the item. An FC% of 33.7% means the item costs 33.7% of its selling price to produce. Gross margin is the inverse — if FC% is 33.7%, the margin is 66.3%. A lower FC% means a higher margin; they always move in opposite directions. MenuCost shows both because different operators use different conventions. Most GCC F&B operators target an FC% of 25–40% depending on item type.
Yes — Sheet 7 of the Excel workbook contains the same allergen data as the on-screen matrix, with colour-coded cells (red for Contains, yellow for May Contain, green for Allergen Free). The sheet is formatted and ready to share with clients, corporate event bookers, or regulatory contacts without any additional work on your end.
Most businesses download it monthly — as a record of their cost position at the end of each month — and again whenever a significant cost change happens (a supplier price rise, a new staff hire, a menu change). Because the live panels in the Reports tab are always current, the Excel download is most useful as a point-in-time snapshot for review, record-keeping, or sharing outside the platform.
See your full business picture-in one report
Join bakeries and coffee shops who manage their menus with confidence.
✓ 7 days free · ✓ Cancel anytime